Tsafack N, Fattorini S, Benavides Frias C, Xie Y, Wang X & Rebaudo F.
Competing vegetation structure indices for estimating spatial constrains in carabid abundance patterns in Chinese grasslands reveal complex scale and habitat patterns. Insects 11, 249. 2020. https://doi.org/10.3390/insects11040249 IF=2.77
Abstract
Carabid communities are influenced by landscape features. Chinese steppes are subject to increasing desertification processes that are changing land-cover characteristics with negative impacts on insect communities. Despite those warnings, how land-cover characteristics influence carabid communities in steppe ecosystems remains unknown. The aim of this study is to investigate how landscape characteristics drive carabid abundance in different steppes (desert, typical, and meadow steppes) at different spatial scales. Carabid abundances were estimated using pitfall traps. Various landscape indices were derived from Landsat 8 Operational Land Imager (OLI) images. Indices expressing moisture and productivity were, in general, those with the highest correlations. Different indices capture landscape aspects that influence carabid abundance at different scales, in which the patchiness of desert vegetation plays a major role. Carabid abundance correlations with landscape characteristics rely on the type of grassland, on the vegetation index, and on the scale considered. Proper scales and indices are steppe type-specific, highlighting the need of considering various scales and indices to explain species abundances from remotely sensed data.
Keywords: steppes; landscape ecology; vegetation index; normalized difference vegetation index (NDVI); modified normalized difference water index (MNDWI); Gao’s normalized difference water index (NDWI2); tasseled-cap indices; soil-adjusted total vegetation index (SATVI)
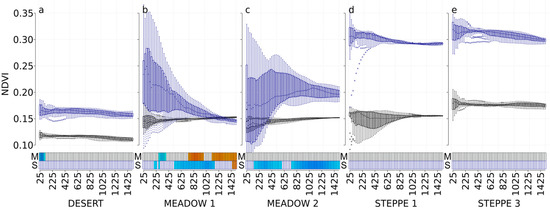
Figure 2. NDVI values at each scale and correlations with carabid abundances for the desert steppe (a), the meadow steppe 1 and 2 ((b,c), respectively), and the typical steppe 1 and 3 ((d,e), respectively). Boxplots represent the NDVI values with a black border for the May 2017 Landsat image and with a dark-blue border for the September 2017 Landsat image. For each boxplot, a different background color indicates a significant difference in NDVI values using the Tukey test. The x-axis presents the different spatial scales used in the analysis (cardinal distances in meters representing circle radius ranging from 25 to 1500 m). The correlation with carabid abundances is represented with rectangles at the bottom of each graph, using a gradient from blue to red (dark blue corresponds to a negative correlation, dark red corresponds to a positive correlation, and white corresponds to no significant correlation).